The Decade(s) of Exhibitions
The exhibition data of 50 contemporary artists from Croatia for a period from 1991 to 2012 was visualized with Processing.
*
△ – male artists ○ – female artists ☐ – groups
white outline – non-commercial exhibition space
black outline – commercial exhibition space
The track Data Science at DAHSS20 introduced no-code platforms and new tools. Continuing the line of DAHSS19, I worked with the exhibitions of contemporary artists from Croatia and presented the data in more detail.
Here is the decade of exhibitions, from 2000 to 2010. The sample includes 50 artists. The exhibition data was collected from artists’ biographies. The maps show their exhibitions in Croatia and abroad. The data was visualized with Datawrapper.
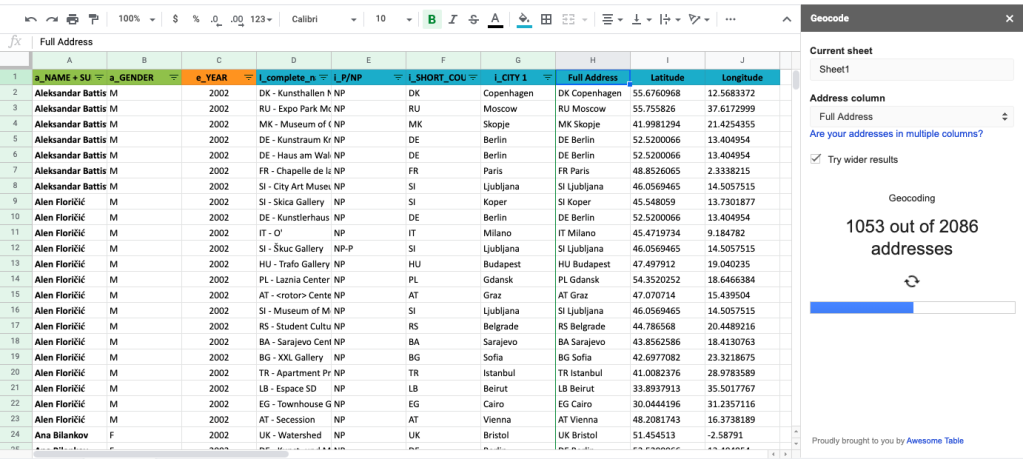
Making maps with Datawrapper is pretty easy. It works even if the only location you have in your spreadsheet is a city. However, some mistakes do appear and in order to obtain maximum accuracy, it is necessary to enter longitude and latitude. The add-on Geocode does it quite fast and from there it is very easy to work with a CSV file in the Datawrapper.
What requires a bit more engagement, especially if one has more data, as I do in the “Decade(s) of exhibitions”, are symbol tooltips and cluster tooltips. To give more information about the symbols and clusters, the tooltips need to be customized. And, here one encounters the following notice:
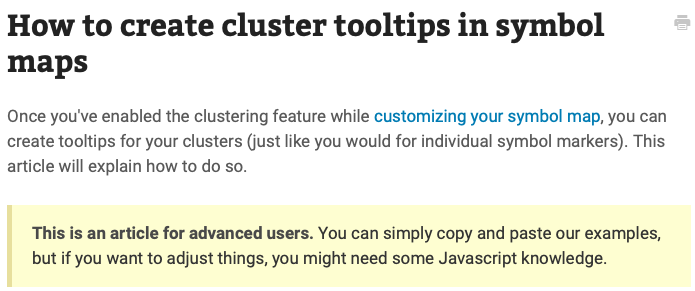
So, for the moment, info on every exhibition displayed (the name of the artist, the name of the institution, the year of the exhibition etc.) that is in the spreadsheet, is not visible on the Datawrapper map. Hopefully, soon…
In the context of exhibition-related research, the track Data Science brought much more. Interesting possibilities for the collection of data on exhibitions and artists from social media and museum websites can be found using Integromat. In Integromat one can create a scenario, as visible below, and extract both photos and captions from, in this example, Instagram.
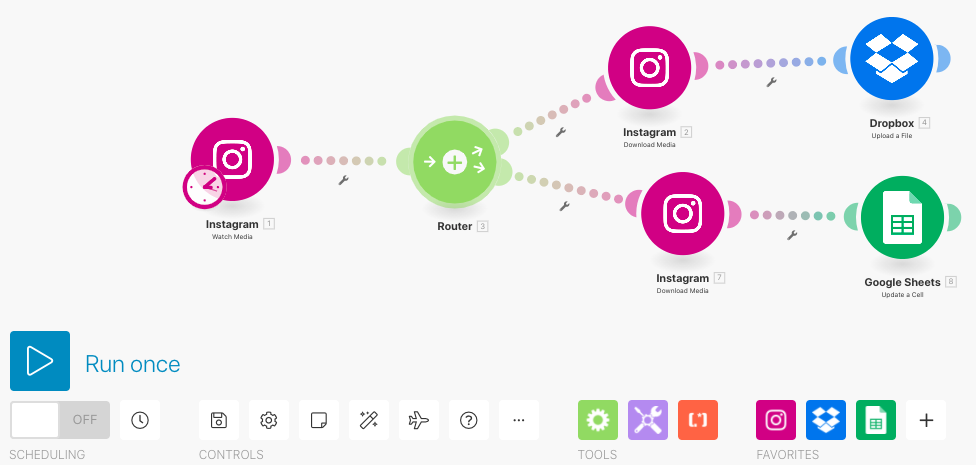
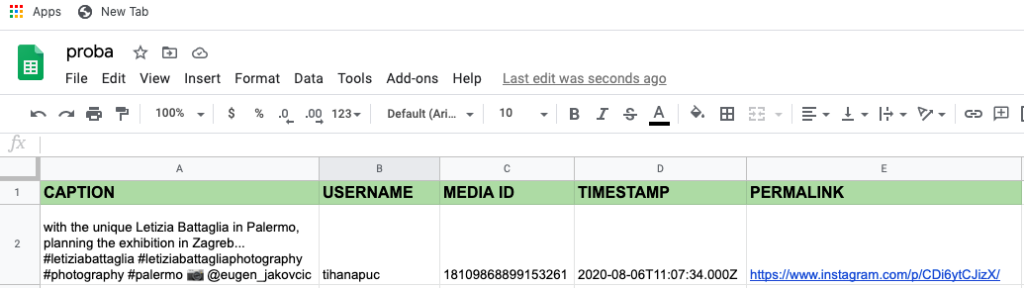
You can download photos to Dropbox and captions to a Google Spreadsheet, and get them perfectly organized. However, for now, the possibilities with Instagram are quite limited as you can only watch your own posts.
But, the future of these scenarios could bring interesting food for research. As does every edition of DHASS.