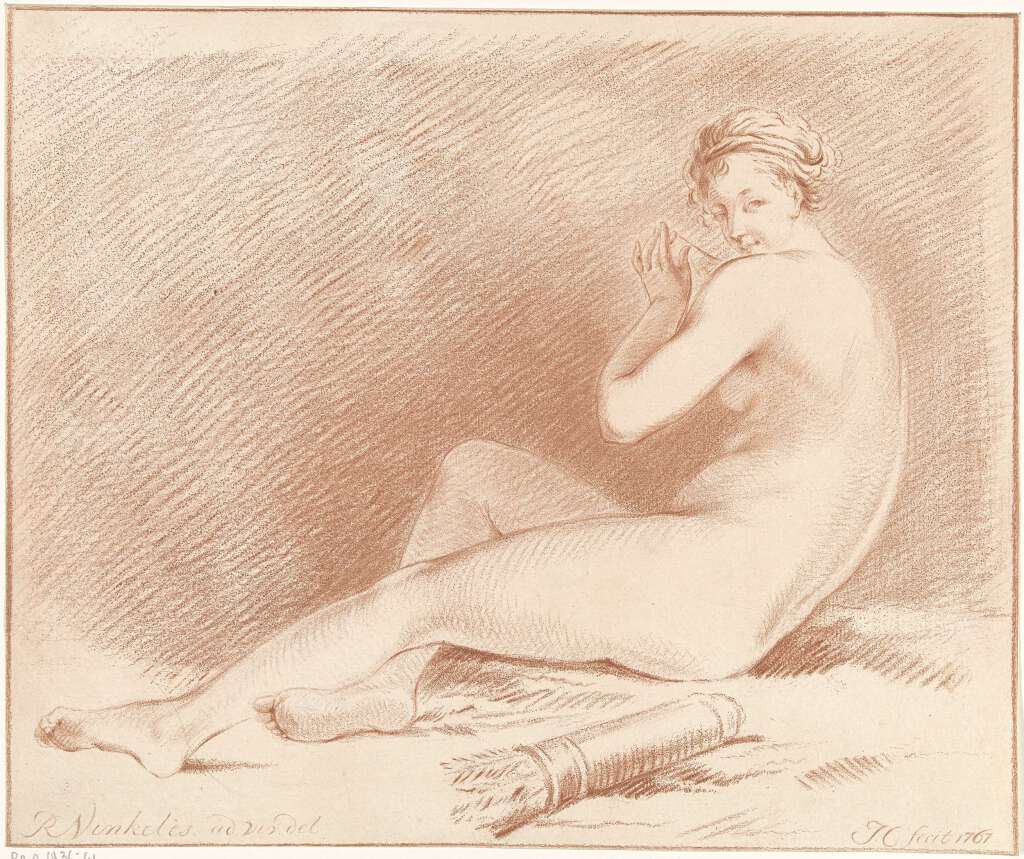
Venus, Jurriaan Cootwijck, 1767
Exploring iconography in the cloud
Data could analysis could be an interesting resource to find, explore and query data. My project aims to visualize the most important artworks representing the same subject stored in the Rijksmuseum database collection ordered by century. This could help to understand different styles, perception, cultural aspect that can influence the representation and interpretation of iconography during the time. The first subject is Venus.

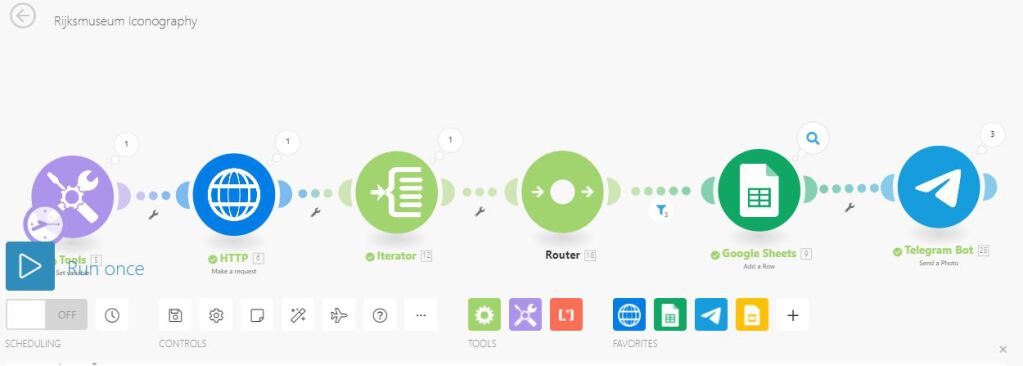
The first step of the project was to set up an Integromat scenario. Once defined as variable the subject “Venus”, it’s possible to make an HTTP request to the API’s endpoint of the wished database. All the results required, in this case, limited to 3, are shown both in a Google Sheet and in a Telegram bot.
Running the process several times changing just the century variable, three items per century appears.

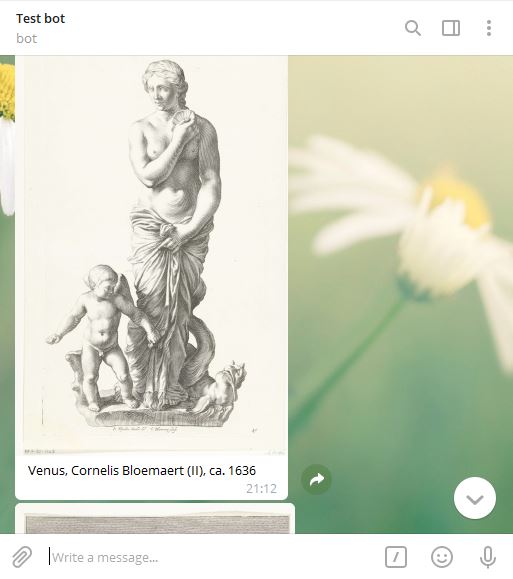
In order to display items obtained, artworks images are seen to a Telegram Bot. In this way it’s possible to see the chronological order from the smartphone, creating a customized exhibition in which it’s easy to compare iconographies.
Data in the cloud seem infinite and offering infinite possibilities: it’s just up to us to understand how to find them, in order to make them being meaningful to us.